神经网络提取PDF表格工具来了,支持图片,还能白嫖谷歌GPU资源
|
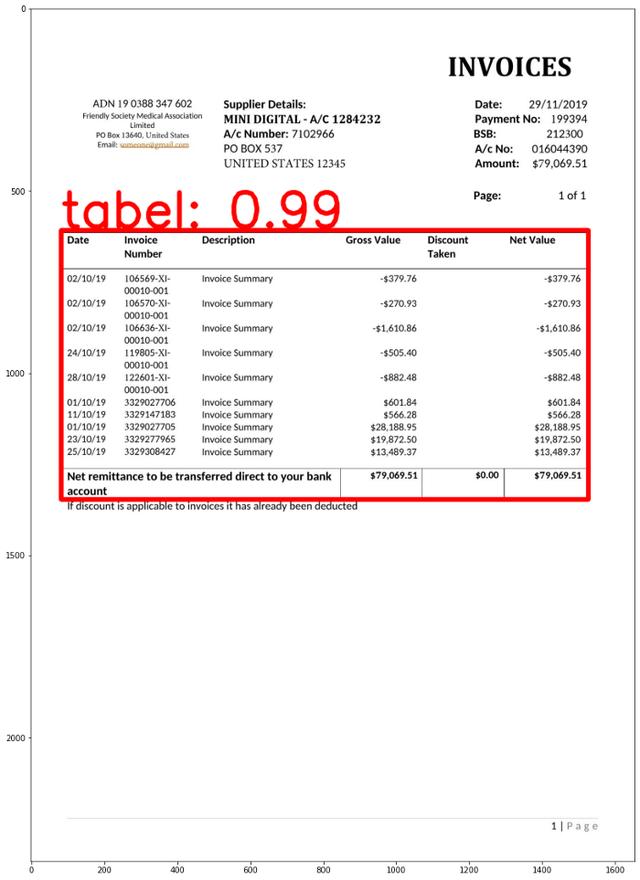
本文经AI新媒体量子位(公众号ID:QbitAI)授权转载,转载请联系出处。 “表哥表姐”们还在为大量PDF文件中的表格发愁吗? 百度一下,网上有大量提取PDF表格的工具,但是,它们都只支持文本格式PDF。 但扫描生成的图片表格怎么办? 别着急,一种使用深度神经网络识别提取表格的开源工具可以帮助你。 兼容图片、高准确率、还不占用本地运算资源,如此实用的工具值得你拥有。 测试实例 如果在输入的PDF文件中检测的表格,模型会在边界框(bounding box)标出表格边框:
然后,表格数据会被转化为Panda数据框架,方便后续处理:
怎么样,是不是很实用?那这个工具如何使用呢? 使用姿势详解 神经网络算法,还不占用本地运算资源? 对,你没听错,这个工具的所有代码都可以在谷歌Colab上运行。也就是说你可以利用Colab云端资源完成训练和推理,无需本地安装。 这个工具使用到的深度神经网络是Keras-RetinaNet,首先要在Colab上安装Keras-RetinaNet,通过一下一行代码就可以完成: git clone https://github.com/fizyr/keras-retinanet 同时需要安装必要的库: pip install .python setup.py build_ext — inplace 训练Keras-RetinaNet识别表格 首先要构建或一个训练使用的数据库。 这里要用到Colab工具PDF2Img,将PDF文件转为JPG格式供算法学习。
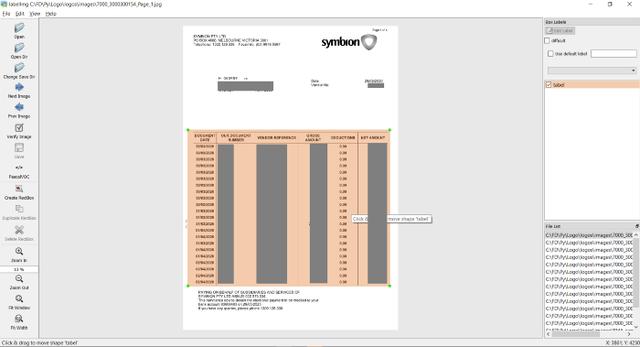
然后将转好的图片保存在Images文件夹中。接下来需要手动给这些训练数据打标签,这里推荐使用在线标记工具makesense.ai。
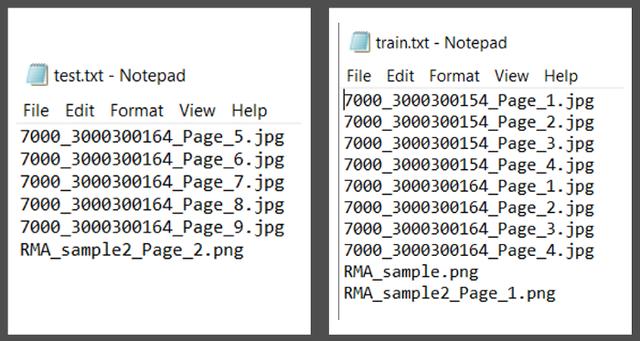
将XML注释文件保存在注释文件夹中,并创建用于培训和测试的PDF文件列表,将该列表导入train.txt和test.txt中。
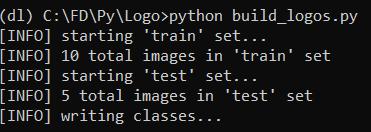
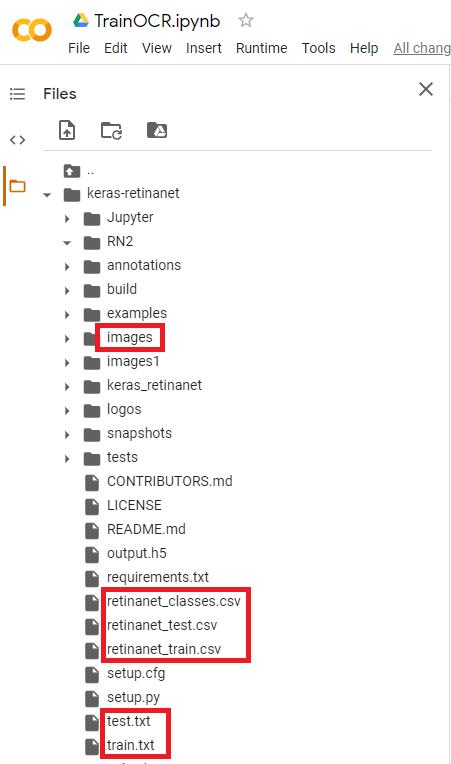
接下来,克隆Github项目https://github.com/ferrygun/PDFTableExtract,并安装beautifulsoup。 运行以下命令以将PASCALVOC格式转换为Keras-RetinaNet所需的格式: python build_logos.py 运行上述命令后,会得到retinanet_classes.csv,retinanet_test.csv和retinanet_train.csv。 在retinanet_classses.csv中,由于只识别PDF文档中的表,所以只有到一个class,即class 0。 如果你在打标签的过程中加入页眉页脚等标签,相应能得到多个class。 完整的文件和文件夹结构的列表:
然后,将retinanet_classes.csv,retinanet_test.csv,retinanet_train.csv,train.txt和test.txt 导入keras-retinanet的根文件夹中:
接下来,运行Colab TrainOCR,可以根据要训练的JPG文件数量来调整训练的epoch数量。 训练完成后,就会得到权重文件output.h5,下载此文件并将其保存到本地主机。后面将使用该文件来运行测试。
这里需要注意的一点是,在Colab中,已将文件上传到Git并进行了Git克隆。 运行测试 运行测试前,还需要安装处理PDF文件必要的库。 PyPDF2是一个python工具库,能够提取文档信息,裁剪页面等。 使用以下命令安装此库: pip install PyPDF2 Camelot是专门用于解析PDF页面表格的python库。 使用以下命令安装此库: pip install camelot-py[cv] PDF2IMG是将Python转换为PIL Image对象的python库。 使用以下命令安装此库: pip install pdf2imag 在运行预测之前,需要使用从训练中获得的权重文件output.h5加载模型,并从retinanet_classes.csv定义标签class 0。 model_path = ‘output.h5’model = models.load_model(model_path, backbone_name=’resnet50’)labels = ‘retinanet_classes.csv’LABELS = open(labels).read().strip().split(‘ ’)LABELS = {int(L.split(‘,’)[1]): L.split(‘,’)[0] for L in LABELS}print(LABELS){0: ‘tabel’} 接下来运行测试 import numpy as npimport cv2import matplotlib.pyplot as pltimage_path = imgfname#image = cv2.imread(image_path)image = read_image_bgr(image_path)image = cv2.cvtColor(image, cv2.COLOR_BGR2RGB)output = image.copy()output = cv2.cvtColor(output, cv2.COLOR_BGR2RGB)print(output.shape) # row (height) x column (width) x color (3)image = preprocess_image(image)(image, scale) = resize_image(image)image = np.expand_dims(image, axis=0)# detect objects in the input image and correct for the image scale(boxes, scores, labels) = model.predict_on_batch(image)boxes /= scaleconfidence = 0.2from google.colab.patches import cv2_imshowimport matplotlib.pyplot as pltlabel_out = []result = ""# loop over the detectionsfor (box, score, label) in zip(boxes[0], scores[0], labels[0]): # filter out weak detections if score < confidence: continue # convert the bounding box coordinates from floats to integers box = box.astype("int") # build the label and draw the label + bounding box on the output # image labeli = label label = "{}: {:.2f}".format(LABELS[label], score) print(label) if LABELS[labeli] not in label_out: label_out.append(LABELS[labeli]) cv2.rectangle(output, (box[0], box[1]), (box[2], box[3]), (255, 0, 0), 12) print(box[0]) print(box[1]) print(box[2]) print(box[3]) #result cv2.putText(output, label, (box[0], box[1] - 10), cv2.FONT_HERSHEY_SIMPLEX, 4.5, (255, 1, 1), 12)plt.figure(figsize=(20, 20))plt.imshow(output)plt.show() 如果检测的表格,模型会在边界框(bounding box)标出表格边框:
边界框坐标(x1,y1,x2,y2),将table_area输入到Camelot read_pdf函数中,table_area是已标准化的边界框。 (编辑:应用网_阳江站长网) 【声明】本站内容均来自网络,其相关言论仅代表作者个人观点,不代表本站立场。若无意侵犯到您的权利,请及时与联系站长删除相关内容! |